The Ultimate Guide to API Load Testing for OTT Platforms
At our company, we pride ourselves on designing scalable architectures and tackling complex challenges for high-traffic applications. Recently, we architected a cutting-edge OTT platform designed to handle 10 million concurrent users—a significant milestone that presented a unique challenge: effectively load testing the APIs to ensure the system could reliably handle such massive traffic.
Load testing is often an undervalued skill in the industry, yet it requires meticulous planning and precise execution to gather meaningful data for analysis. In this blog, we’ll share our detailed experience and insights into how we approached this critical task, ensuring the platform’s readiness for peak demand.
Business Challenges
- Ensures High Availability: Load testing validates the platform’s ability to handle millions of concurrent users, ensuring uninterrupted access even during peak demand times.
- Prevents Downtime: Simulating high-traffic scenarios allows load testing to identify potential bottlenecks and vulnerabilities, reducing the risk of crashes or service interruptions.
- Enhances User Experience: A well-performing platform with fast load times and seamless streaming keeps viewers engaged, minimizing buffering and improving overall user satisfaction.
- Optimizes Infrastructure Costs: Load testing helps in efficient resource allocation, ensuring the platform runs on optimized infrastructure, preventing over-provisioning, and controlling costs.
- Supports Scalability: As the platform grows, load testing ensures that it can scale effectively to accommodate increased traffic without compromising performance or reliability.
What is Distributed Load Testing and Why Does It Matter for OTT?
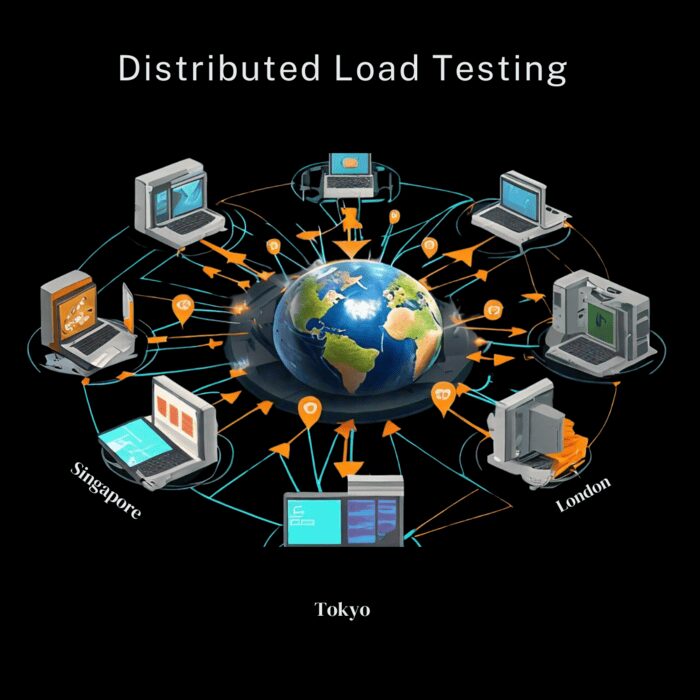
Distributed load testing is a method of evaluating the performance of an application or system by simulating multiple users interacting with it simultaneously from various geographical locations. Unlike traditional load testing, which might be conducted from a single server or location, distributed load testing utilizes several machines (load generators) distributed across different regions or environments. These generators work together to mimic real-world user behavior, effectively creating a scenario where thousands or millions of concurrent users are accessing an application, just as they would in reality.
For OTT (Over-the-Top) platforms, which deliver content over the internet—such as video streaming, live events, or on-demand services—distributed load testing becomes particularly important. It helps OTT platforms assess their ability to handle large-scale traffic without compromising user experience.
Key Components of Distributed Load Testing
Load Generators: These are virtual or physical machines used to send traffic to the target application. In a distributed setup, multiple generators are spread across different locations to simulate geographically dispersed user behavior.
Test Scenarios: Pre-defined scenarios that mimic real user interactions such as video playback, content browsing, or switching between streams. These scenarios help test different types of loads.
Metrics Collection: During the test, critical metrics like response times, server CPU and memory usage, throughput, and error rates are collected to evaluate performance.
Key Challenges OTT Platforms Face with High Throughput Demands
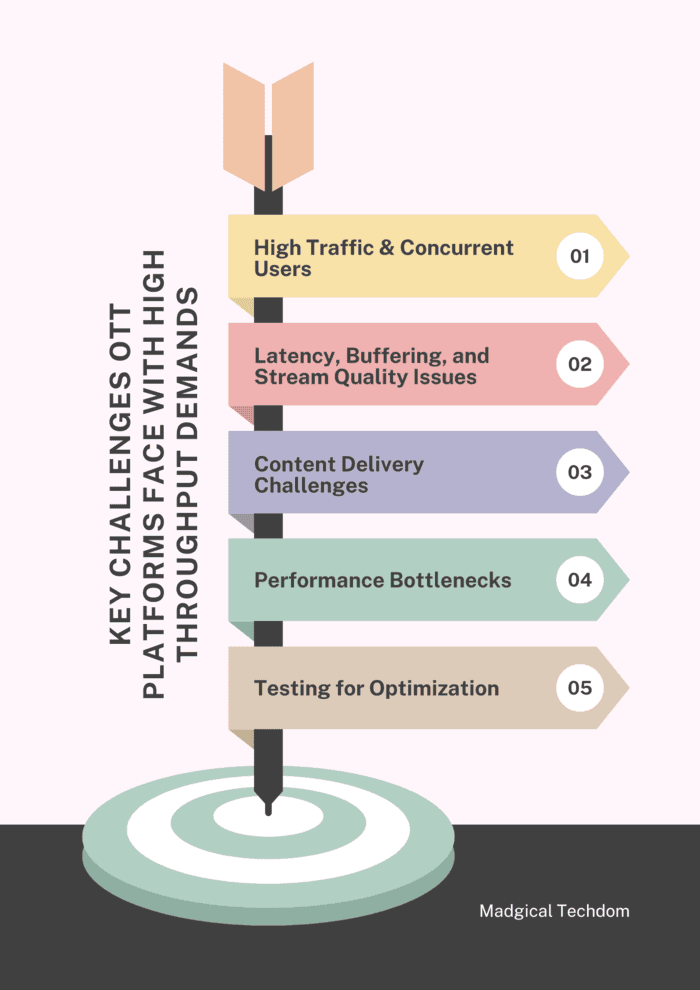
OTT platforms are designed to handle a diverse and ever-growing user base, but with this scalability comes significant challenges. High throughput demands, driven by high traffic, concurrent users, and the need for seamless content delivery, can severely impact performance. Let’s explore these challenges and how to address them effectively.
Impact of High Traffic and Concurrent Users on Performance
When thousands or even millions of users access an OTT platform simultaneously, especially during peak events like live sports or new releases, the system can become overwhelmed, leading to degraded performance. Key issues include:
- Increased Latency: A sudden spike in user requests can overload servers, leading to longer response times for API calls, user authentication, or content searches.
- Server Overload: Without sufficient resources or load balancing, application servers may crash under the weight of high concurrency.
- Database Contention: High traffic increases read/write operations on the database, causing contention and slower queries.
Solution:
- Scalable Architecture: Use cloud-based, horizontally scalable systems with auto-scaling capabilities to manage traffic surges.
- Load Balancing: Optimize load balancers to distribute traffic efficiently across servers and regions.
- Testing for Scalability: Conduct stress and capacity tests to determine the platform’s threshold and address bottlenecks before they impact users.
Latency, Buffering, and Stream Quality Degradation
Latency: High latency can occur due to delays in content delivery, especially for users located far from data centers.
Buffering: Buffering issues arise when the streaming server cannot keep up with the playback rate due to slow networks or limited bandwidth.
Quality Degradation: If the platform fails to adapt effectively to changing network conditions, users may experience lower resolution or pixelation.
Solution:
- CDNs: Implement Content Delivery Networks (CDNs) to reduce latency by delivering content from the closest edge server to the user.
- Adaptive Bitrate Streaming: Dynamically adjust stream quality based on the user’s internet speed to minimize buffering.
- Pre-Testing for Real-World Scenarios: Simulate various network conditions during testing to ensure the system can deliver optimal performance in all situations.
Tools and Frameworks for Distributed Load Testing in OTT Platforms
Popular Load Testing Tools
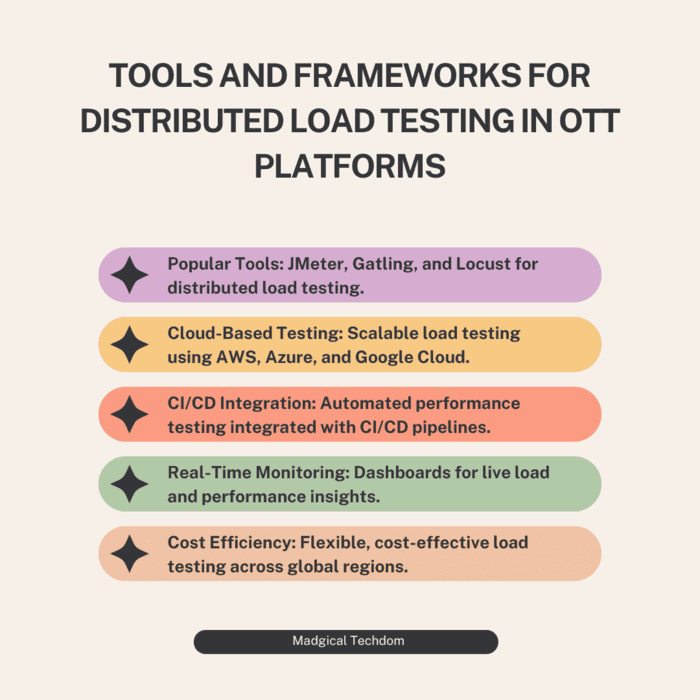
As OTT platforms grow, ensuring consistent performance under massive user loads becomes a critical priority. Distributed load testing plays a key role in simulating real-world scenarios where millions of users interact with the platform simultaneously. To achieve this, selecting the right tools and frameworks is crucial. Here’s an overview of some popular tools, scalable solutions, and how they can be seamlessly integrated into CI/CD pipelines for automated performance testing.
Popular Load Testing Tools
Effective load testing begins with reliable tools that allow for comprehensive simulation and analysis:
- JMeter: A widely-used, open-source tool capable of simulating high traffic loads on APIs, servers, and applications. Its plugin ecosystem and support for various protocols make it a favorite among testers.
- Gatling: Designed for developers, Gatling offers a DSL-based scripting language, allowing for quick test setup and the ability to handle complex scenarios. Its detailed reports make it easier to pinpoint bottlenecks.
- Locust: A Python-based tool that enables distributed testing, allowing for millions of users to be simulated across multiple machines. Its flexibility makes it ideal for large-scale scenarios.
Cloud-Based Solutions for Scalability
While traditional tools are effective, simulating large-scale traffic often requires additional resources. This is where cloud-based solutions shine:
- Tools like BlazeMeter, K6 Cloud, and LoadRunner Cloud allow testers to scale their simulations on demand.
- These platforms provide the flexibility to generate traffic from multiple global locations, mimicking the diverse user base of OTT platforms.
- Cloud solutions also eliminate the need for extensive on-premises infrastructure, reducing costs and setup complexity.
Integration with CI/CD Pipelines
Incorporating load testing into CI/CD pipelines ensures performance remains a priority throughout the development lifecycle:
- Automated load tests can be triggered with each code commit, merge, or deployment.
- This helps identify performance regressions early, ensuring issues are addressed before reaching production.
- Tools like Jenkins, GitHub Actions, or CircleCI can integrate with load testing tools to automate these workflows seamlessly.
Why Distributed Load Testing Matters
For OTT platforms, where user engagement peaks during live events or new content releases, performance issues can lead to customer dissatisfaction and lost revenue. Distributed load testing ensures the platform can handle such spikes efficiently by:
- Providing actionable insights to optimize infrastructure and application performance.
- Simulating millions of concurrent users interacting with various features.
- Analyzing system performance under high stress, including response times, server stability, and database throughput.
The Role of Application Performance Monitoring (APM) in OTT Platforms
Application Performance Monitoring (APM) tools like New Relic and Datadog are essential in identifying bottlenecks and hotspots during API testing of an OTT platform. APIs are critical to the platform’s operation, as they handle user authentication, content streaming, recommendations, and interactions with various backend services. Ensuring that APIs perform optimally under load is crucial to the smooth functioning of the platform, especially when serving millions of concurrent users.
Here’s how APM tools can help identify bottlenecks and hotspots in API testing:
Monitoring API Performance in Real Time
APM tools provide real-time monitoring of API performance, tracking key metrics such as response times, request rates, throughput, and error rates. For an OTT platform, these metrics help ensure that APIs are responsive even under heavy load and do not become a bottleneck in the user experience.
- Response Time Monitoring: APM tools track the average response time of each API endpoint, identifying any that are slow or underperforming. If an API that manages content streaming or user authentication slows down, it can be quickly detected and investigated.
- Request Rate Monitoring: Tracking how many requests each API is handling per second can reveal whether specific APIs are under stress due to high traffic and whether they can handle the expected load.
Transaction Tracing for API Calls
APM tools provide transaction tracing, which allows teams to follow the entire lifecycle of an API request across the platform’s services. For an OTT platform with complex backend architectures, transaction tracing helps pinpoint where delays or failures are happening within a given API call.
- APM tools offer distributed tracing that shows how API requests are processed across various microservices. If a particular API request takes too long, tracing helps identify whether the delay is in the application code, a database query, or a third-party service call.
Identifying Slow or Failing Endpoints
APM tools help identify specific API endpoints that are slow or prone to failure. For OTT platforms, where API performance impacts user experience (e.g., content recommendations or search), pinpointing failing or slow endpoints ensures a smooth streaming experience.
- Error Rate Tracking: APM tools log API errors and response codes, showing which API endpoints return a high rate of 4xx or 5xx errors. These errors may indicate issues like authentication failures, timeouts, or invalid responses.
- Latency Insights: APM tools reveal which API endpoints have high latency. For example, an API that fetches user content recommendations might be slow due to inefficient database queries, causing delays in user interactions.
Dependency Analysis
APIs often rely on multiple external services or internal microservices. APM tools can map out the dependencies involved in an API call, helping to identify if delays are caused by external APIs, databases, or third-party services.
- New Relic: Provides dependency maps that show all services involved in handling an API request. For instance, an API responsible for content delivery might rely on a database, CDN, and external video transcoding services. If any of these dependencies become a bottleneck, New Relic highlights the service responsible.
Database Query Optimization
APIs in OTT platforms often interact with databases to fetch user preferences, content metadata, or billing information. APM tools help identify slow database queries that can cause API response times to increase, especially under heavy traffic.
- Query Performance Analysis: APM tools, such as New Relic, can identify slow or inefficient database queries that are invoked by APIs. For example, if an API is fetching a large dataset without proper indexing, it can slow down the entire API response.
Designing Effective Distributed Load Testing Strategies for OTT
Setting benchmarks for acceptable performance and defining KPIs.
- Latency and Throughput: API Latency should be analyzed in percentiles (95th and 99th) to avoid misleading averages, especially when response times are skewed. For example, a 95th percentile latency of 200-250 ms at 10,000 TPS is a strong benchmark. Throughput must be considered alongside latency, with realistic targets based on platform needs. For instance, our platform achieved 25,000 TPS with a latency of 250-300 ms.
- Error Rate: The percentage of requests that result in errors (4xx and 5xx) is critical for system health. Keeping the error rate low ensures a smoother user experience and minimizes disruptions. We kept the tolerable error rate to be 0.5%.
- Availability and Uptime: Ensuring the platform is consistently accessible is vital for business continuity. High availability (99.99% uptime) is typically the goal for a robust OTT platform.
- Concurrency: Monitoring peak and average concurrency levels helps ensure the platform can handle large traffic spikes without degrading performance. We have designed the system to handle a minimum of 10 Million concurrent users and the peak load of 50 Million concurrent users.
- CPU and Memory Utilization: Tracking server resource usage (CPU, memory) ensures the platform remains efficient, especially under high traffic. Monitoring resource constraints helps avoid bottlenecks.
- Network Bandwidth Utilization: Efficiently utilizing available bandwidth ensures optimal content delivery without straining infrastructure. This metric also informs decisions about scaling and CDN optimization.
- Cache Hit Ratio: A high cache hit ratio, which measures the percentage of requests served from the cache, reduces latency, and improves overall platform performance.
Key factors to consider: load patterns, peak usage hours, and geographical locations.
Load Patterns
Load patterns refer to the variation in traffic and usage intensity over time. Analyzing load patterns helps in identifying how traffic fluctuates throughout the day, week, or year, and planning the platform’s infrastructure accordingly.
- Consistent Load: If the platform has a steady stream of users with minimal traffic variation, the infrastructure can be designed to handle a predictable load without significant scaling.
- Variable Load: Platforms with varying load patterns, where traffic surges during specific times (e.g., after work hours or during live events), need elastic infrastructure that can automatically scale up and down based on demand.
- Burst Traffic: For events like sports matches, live concerts, or special releases, the platform may experience sudden and short-term spikes in traffic. These require rapid scaling to prevent outages and ensure smooth performance during critical times.
Peak Usage Hours
Peak usage hours are the times when the highest number of users access the platform, often leading to high demand on resources, including bandwidth, server capacity, and data processing.
- Identifying Peak Hours: For most OTT platforms, peak hours typically occur during evenings or weekends when users are more likely to stream content. However, these times can vary based on target audiences, content genres, or geographical location.
- Scaling for Peak Demand: During peak hours, the infrastructure must be prepared to handle significant traffic without performance degradation. This means having sufficient resources (compute, storage, bandwidth) in place, as well as the ability to scale quickly.
- Content Preloading and Caching: For on-demand content, preloading popular titles to CDNs and caching can reduce strain on the platform during peak times and improve load times for users.
Geographical Locations
The geographical distribution of users has a significant impact on content delivery, latency, and overall performance. Different regions may experience different network conditions, which can affect how content is delivered to end-users.
- Latency Concerns: Users far from the platform’s data centers may experience higher latency, resulting in slower response times, buffering, and degraded quality. To minimize latency, it’s important to use Content Delivery Networks (CDNs) that have edge locations close to users.
- Regional Bandwidth Limitations: In some regions, network infrastructure may be less robust, which could lead to slower internet speeds for users. OTT platforms must optimize content delivery (e.g., using adaptive bitrate streaming) to accommodate users in low-bandwidth areas.
- Localized Content: Some regions may require different content due to language, cultural preferences, or legal requirements (e.g., GDPR in Europe). Delivering tailored content based on location ensures a better user experience.
Simulating high throughput and ensuring network resilience
Simulating high throughput across multiple regions requires running load tests simultaneously to replicate real-world traffic. Gradually ramping up the load mimics user trends, while sudden spikes simulate burst traffic during events like live streams.
Optimizing the network is critical to ensure sufficient bandwidth for virtual machines, load balancers, and firewalls. Poor bandwidth allocation can lead to latency and performance issues.
Choosing the right load balancer is crucial. Layer 4 load balancers typically handle throughput above 10,000 TPS better than Layer 7. For Layer 7 Application Load Balancers (ALB), pre-warming on AWS is necessary to match the required load and prevent bottlenecks during traffic surges.
Common Performance Bottlenecks in OTT Platforms and How to Resolve Them
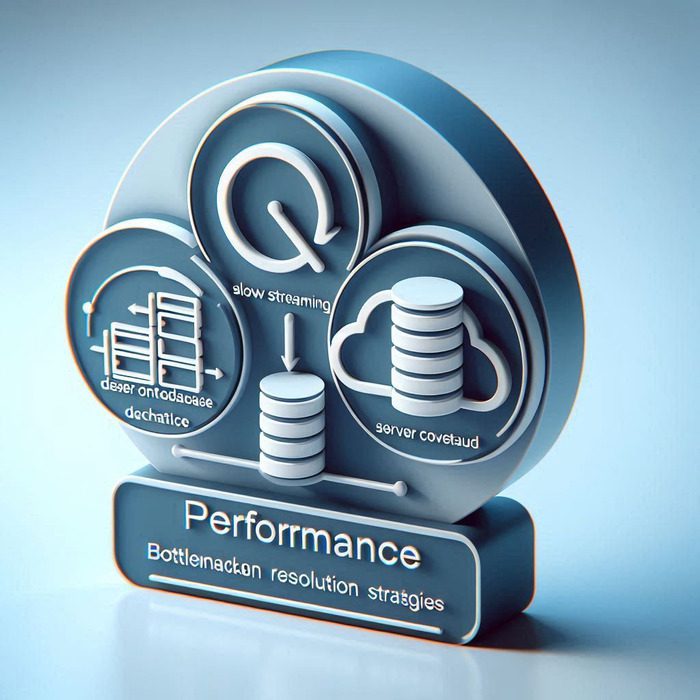
OTT platforms are required to deliver high-quality, uninterrupted streaming experiences to many users simultaneously. However, several performance bottlenecks, including slow streaming, server overload, and database contention, can hinder this. Here’s a breakdown of these common issues and how to tackle them effectively.
Slow Streaming
Issue: Slow or buffering streams are often a result of network congestion, under-optimized content delivery systems, or bandwidth limitations.
Solution:
- Content Delivery Networks (CDNs): Leverage CDNs to distribute content across various servers globally. This reduces latency by serving content from the closest node to the user.
- HTTP/2 and Compression: Using HTTP/2 protocol and content compression techniques like Gzip can reduce load times for media and related assets.
Server Overload
Issue: OTT platforms can experience server overload, particularly during peak usage or special events (e.g., live sports or premieres), leading to crashes or degraded performance.
Solution:
- Horizontal Scaling: Use auto-scaling to provision additional server instances based on real-time demand. This allows the platform to handle high traffic without performance degradation.
- Load Balancing Optimization: Configure intelligent load balancers to distribute traffic across servers efficiently. Techniques like round-robin, least connections, and dynamic load distribution help manage server load.
Database Contention
Issue: High read/write operations in the database, particularly during user authentication, content searches, and playback requests, can lead to contention and slow down the entire system.
Solution:
- Database Sharding: Distribute database reads and writes across multiple shards to reduce contention. This helps improve performance for high-throughput applications.
- Caching Layer: Implement caching for frequently accessed data (e.g., user profiles, recommendations) using solutions like Redis or Memcached. This minimizes database load by serving data from cache instead of querying the database each time.
- Optimized Querying: Regularly analyze and optimize database queries, ensuring proper indexing, query structure, and minimizing N+1 queries.
Load Balancing Optimization
- Use sticky sessions to ensure that user sessions remain on the same server during a session to avoid reloading content multiple times.
- Apply geo-location-based load balancing to route traffic to the nearest server, minimizing latency for global users.
Leveraging Load Test Results and APM Data to Troubleshoot and Optimize
In modern OTT platforms, ensuring optimal performance under high user demand is critical. Combining load testing with Application Performance Monitoring (APM) tools like New Relic enables you to troubleshoot and optimize your platform effectively. Here’s how you can leverage these insights to address performance bottlenecks.
During the load test, several types of issues we identified:
- Slow Response Times: Look for any increase in response times under load. Drill down to specific transactions or endpoints in New Relic to identify which part of the application is slowing down (e.g., database queries, external service APIs, or specific functions).
- Errors and Exceptions: Check for any increase in error rates. New Relic provides detailed stack traces for exceptions, helping to pinpoint the code responsible for failures.
- Throughput Bottlenecks: Examine the throughput and see how the system scales with increased load. If there is a plateau or drop, it indicates bottlenecks in resources such as CPU, memory, or the database.
- Database Query Performance: Use New Relic’s database monitoring to track slow queries, long-running transactions, or frequent retries. You might identify specific queries that need optimization.
- External Services: If the application relies on external services (like third-party APIs), New Relic will highlight delays or failures in those calls, helping you adjust timeouts, retries, or caching mechanisms.
- Memory Leaks: Monitor memory consumption over time to detect any potential memory leaks, which can cause crashes during high traffic.
Deeper Investigation with Traces
- Query Improvement: By reviewing the slow transactions in New Relic, you identified inefficient database queries that were taking longer than expected. These queries were then optimized by either refining the query logic, adding necessary indexes, or reducing complex joins and subqueries.
- Database Connection Pool Adjustment: After optimizing the queries, you noticed that the connection pool size was not well-configured, leading to bottlenecks during heavy traffic. Increasing the pool size in the database configuration helped handle a larger number of simultaneous requests, improving performance under load.
Reduced Query Execution Times: With caching in place, the number of queries hitting the database was reduced, and response times significantly improved for users. New Relic traces showed a marked decrease in the time taken for queries that had been previously flagged as slow
Cache Introduction: To reduce the load on the database and prevent repeated execution of long-running queries, you introduced caching mechanisms. You likely used Redis or another caching system to store frequently accessed data, such as static queries or results that don’t change often.
Scaling Your OTT Platform: Best Practices for Continuous Monitoring and Load Testing
Scaling an OTT platform to support a growing user base requires robust strategies for continuous testing and proactive monitoring. These practices ensure that as your platform expands, it maintains high performance and delivers a seamless user experience. Below are key strategies to achieve this.
Continuous Testing Strategies as the User Base Grows
As the number of users increases, the complexity of maintaining performance grows exponentially. Implementing continuous testing strategies ensures your platform can handle this growth effectively.
Simulating Realistic Traffic Patterns:
- Regularly simulate peak traffic scenarios (e.g., live events or new releases) to test how the system handles high concurrency.
- Incorporate diverse user behaviors, such as streaming, searching, and account activities, to test multiple workflows.
Gradual Scale Testing:
- Conduct incremental load tests that simulate increasing user traffic over time. This helps identify the breaking point and understand the system’s scaling capacity.
Testing Across Multiple Regions:
- Use distributed load testing to simulate user traffic from various geographic locations. This ensures your platform performs well for a global audience and optimizes CDN efficiency.
End-to-End Testing:
- Perform tests that validate the entire system, including APIs, databases, CDNs, and third-party integrations, to ensure all components work cohesively under load.
Integrating automated testing and monitoring into the CI/CD pipeline ensures performance validation becomes a seamless part of your development lifecycle.
Automating Load Tests:
- Use tools like JMeter or Gatling to create automated scripts that run load tests after every significant deployment. This helps catch performance regressions early.
- Schedule regular load tests to monitor performance trends over time.
Integrating APM Tools:
- Embed APM tools like New Relic or Datadog into the CI/CD pipeline to monitor application performance metrics during deployments.
- Use APM data to validate key performance indicators (KPIs), such as response times, error rates, and throughput, against baseline values.
Establishing Performance Gates:
- Set up automated performance thresholds as part of the CI/CD pipeline. Deployments that fail to meet performance benchmarks can be flagged or blocked for further review.
Proactive Monitoring of High Throughput Environments for Future Growth
Monitoring high-throughput environments in real time is crucial for anticipating and addressing potential issues before they escalate.
Real-Time Metrics Collection:
- Continuously monitor critical metrics like server CPU/memory usage, database query performance, and CDN response times using tools like New Relic, Prometheus, or Grafana.
- Set up alerts for anomalies, such as sudden spikes in latency or error rates, to enable rapid response.
Capacity Planning:
- Use historical data from APM tools to forecast future resource needs. Identify trends in user behavior and traffic growth to plan for additional servers, storage, or bandwidth.
User Behavior Analysis:
- Leverage monitoring tools to track how users interact with the platform. For example, identify popular content or regions with high traffic and optimize your infrastructure accordingly.
Scaling Strategies:
- Implement auto-scaling for servers and databases to handle traffic spikes dynamically.
- Use advanced load balancing strategies, such as geo-based or content-aware routing, to optimize resource utilization and improve user experience.
Conclusion: Building Resilient OTT Platforms with Distributed Load Testing and APM
As OTT platforms continue to scale to meet the growing demand for seamless content delivery, ensuring consistent performance under high traffic is paramount. Let’s recap the key takeaways from this guide and explore the holistic approach required to maintain OTT performance at scale.
Recap of Key Points
- Understanding Performance Challenges: OTT platforms face unique challenges, such as server overload, latency, buffering, and database contention, especially during peak traffic scenarios.
- Proactive Bottleneck Resolution: Techniques like optimized load balancing, leveraging CDNs, caching strategies, and database optimization play a critical role in overcoming bottlenecks.
- Importance of Testing and Monitoring: Distributed load testing and Application Performance Monitoring (APM) tools like JMeter and New Relic are essential for simulating real-world traffic, identifying performance issues, and optimizing system components in real time.
- Case Study Insights: Leveraging APM data during load testing can uncover hidden inefficiencies, such as query latency, improper caching configurations, or external API delays, enabling targeted solutions.
Final Thoughts on Maintaining OTT Performance at Scale
Building a resilient OTT platform requires more than just robust infrastructure; it demands continuous testing, monitoring, and optimization. Distributed load testing ensures your platform can handle geographically dispersed users, while APM tools provide real-time insights into performance and reliability. Together, these approaches enable you to proactively address potential issues before they impact users.
To maintain OTT performance at scale, you need a holistic strategy:
- Load Testing Beyond Limits: Regularly stress-test your platform to simulate high concurrency, peak traffic events, and regional surges.
- Continuous Monitoring with APM Tools: Use tools like New Relic to monitor metrics like response times, server health, and third-party API performance in real time.
Feedback Loop for Optimization: Combine testing and monitoring data to create a feedback loop for continuous improvement, ensuring your platform evolves with user demands and traffic patterns.
Thank you for Reading !! 🙌🏻😁📃, see you in the next blog.🤘
I hope this article proves beneficial to you. In the case of any doubts or suggestions, feel free to mention them in the comment section below or Contact Us.
The end ✌🏻
Further reading
- 30% Time Savings in AI Development: The EKS CI/CD Solution.
- Everything You Need To Know – How To Deploy Firebase Functions Using GitHub Action?
- How to Optimize QA Automation for 30% Quicker Releases.
- Transforming Education: How GenAI Video Search Drove Ed Tech Growth
- How To Cut Cloud Storage Pricing For AI-Chatbots By 80%?
Disclaimer
The views are those of the author and are not necessarily endorsed by Madgical Techdom.