Discover the Secret to Better EC2 Monitoring

Introduction
With today’s education-led digital economy, organizations that offer learning experiences at scale rely heavily on cloud infrastructure for uninterrupted access, performance, and user satisfaction. EC2 monitoring is essential to ensure these platforms, which support thousands of learners, educators, and administrators, remain stable, responsive, and reliable.
At our company, we focus on constructing robust, observable, and optimized cloud environments tailored to each client’s operational goals. From smart alerting mechanisms to automated backup plans, we enable education-sector clients to stay focused on impact while we manage the critical infrastructure behind the scenes.
One of our clients, a mission-driven education services company, was rapidly scaling its platform to serve users across multiple regions. As their infrastructure grew, the complexity of maintaining platform stability also increased. At the same time, implementing effective EC2 monitoring, setting up alerting systems, and ensuring data protection became critical. In this blog, we share the real-world solution we delivered. We started by deploying monitoring tools across compute and database resources. Then, we automated backup strategies. As a result, the client experienced improved reliability, smoother operations, and greater control over their growing environment.
Problem Statement

When the infrastructure of the client expanded, various significant gaps in monitoring and operational resilience were visible, exposing system availability and stability risks.
1. No Server Health Alerts
There was no alerting and active monitoring of critical system metrics such as CPU usage, memory usage, or disk space. Lacking alerts, problems would not be visible until they affected service performance.
2. No Database Health Alerts
The databases did not have any alerting system for important performance indicators like storage capacity, CPU usage, or connection limit. This was a problem because it was hard to identify and solve possible issues before they resulted in outages.
3. No Automated Backup or Retention Plan
Initially, no automatic backup mechanism existed for creating backups or handling the life cycle of those backups. Consequently, this was riskier and created a slow and manual recovery process.
4. Absence of Real-Time Notifications
When a serious issue occurred, such as excessive CPU usage, a full disc, or an unresponsive database, there was no automated alert system in place to instantly alert the operations or administrative staff. As a result, problems were typically discovered by hand, which led to longer outages and delayed diagnosis.
5. Lack of Historical Metric Data for Audit & Analysis
There was no proper historical logging of important parameters like CPU usage, memory usage, disk usage, and database performance. As a result, it was impossible to conduct root cause analysis following an incident or to study long-term performance patterns. This deficiency made proactively planning for and optimizing the infrastructure nearly impossible.
These gaps emphasized the necessity for an end-to-end monitoring and backup solution in order to enhance system reliability and minimize operational risks.
Our Solution
To address the critical gaps in infrastructure observability and reliability, we designed and implemented a monitoring and alerting solution using native AWS services. As a result, the goal was to enable proactive system health management, real-time notifications, automated backups, and historical metric tracking without adding unnecessary complexity or cost
Here’s how we solved each challenge:
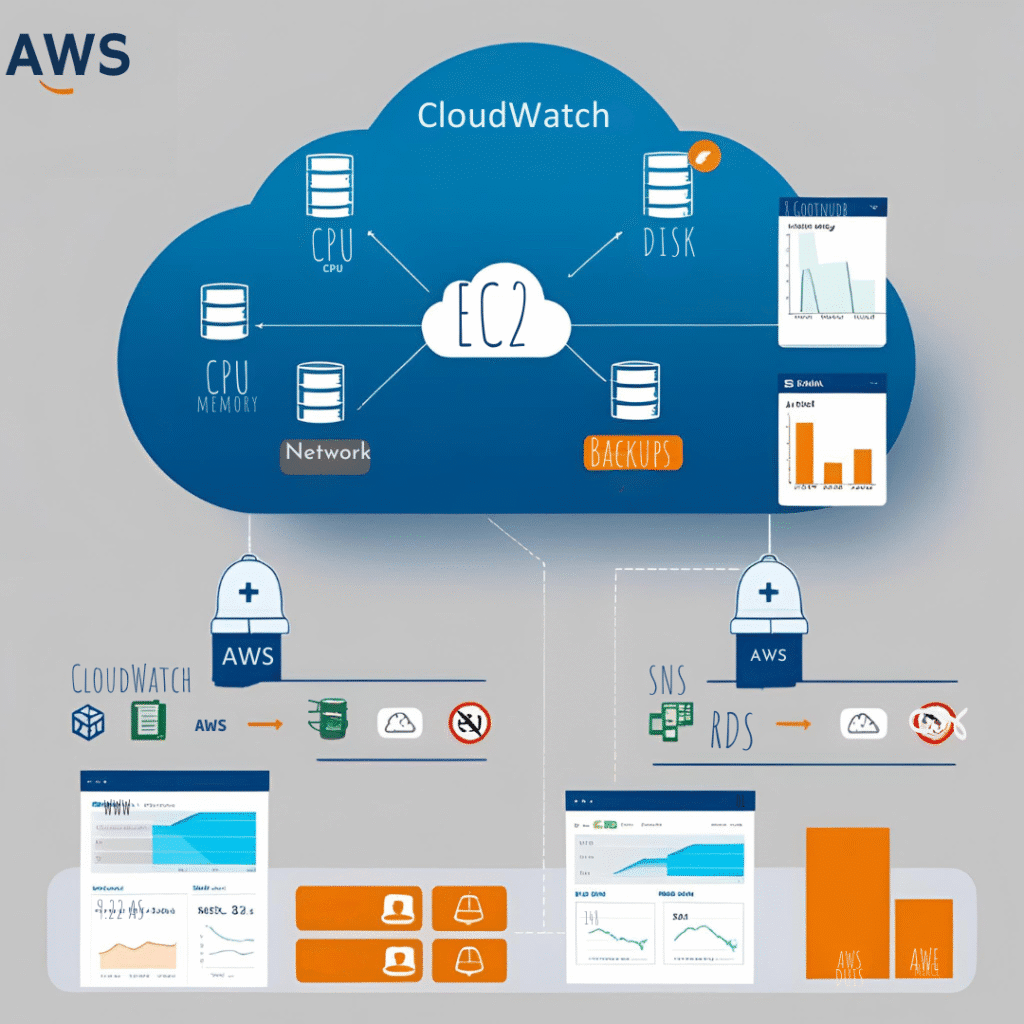
1. Server Health Alerts with Amazon CloudWatch Agent
To track important system-level metrics such as CPU usage, memory usage, and disk usage, we deployed and set up the Amazon CloudWatch Agent in all EC2 instances. The agent collects metrics in detail from the operating system and sends them to Amazon CloudWatch.
We then set up CloudWatch Alarms by thresholds (e.g., disk usage ≥ 80%) to monitor perpetually for indications of resource depletion or deterioration.
2. Database Health Monitoring with Amazon CloudWatch Alarms
When it came to Amazon RDS, we relied on CloudWatch’s built-in metrics to keep an eye on crucial database health indicators. These included CPU usage free storage space active connections, and how long it took to read and write data. We set up CloudWatch Alarms with chosen thresholds for each database engine and workload type. This approach allowed us to spot performance issues and capacity limits before they became problems. As a result, we could step in and fix things preventing any impact on our applications.
3. AMI Backup Automation with AWS Data Lifecycle Manager (DLM)
To counter the lack of automatic backups of servers, we instituted AWS Data Lifecycle Manager (DLM). Consequently, we designed DLM policies to automatically create daily AMI snapshots of the EC2 instances and retention rules to delete older backups after a specified number of days. This ensured a rolling backup system was in place without human intervention.
4. Real-Time Notifications with Amazon SNS
To facilitate real-time notifications, we linked all CloudWatch Alarms with Amazon Simple Notification Service (SNS).
A SNS topic infralalerts-prod, as an example, was created and key stakeholders (Administrators and Operators) were subscribed using email and text message notifications. Any severe system alarm such as disk full, RDS CPU spike, or system down generates a notification to the pertinent team.
5. Centralized Historical Metrics for Audit & Analysis
All data gathered through the CloudWatch Agent and RDS monitoring were saved in Amazon CloudWatch, therefore allowing centralized storage of historical data. Since detailed monitoring was enabled and log retention set according to business requirements, we were able to examine long-term performance trends, perform root cause analysis after incidents, and gain insights to inform future scaling and capacity planning.
Solution Implementation

Because the client infrastructure is EC2 instances of Ubuntu, all the commands hereafter are Linux/Ubuntu-specific. The objective is to build an entire observability stack with native AWS services to allow system monitoring, alerting, automatic backups, and real-time dashboards.
Step 1: Install and Configure CloudWatch Agent on EC2 Instances
By default, EC2 instances only send basic metrics (like CPUUtilization) to CloudWatch every 5 minutes. To get granular and advanced monitoring, we need to:
- Enable Detailed Monitoring (1-minute granularity)
- Install CloudWatch Agent to collect OS-level metrics such as memory, disk, swap, and network.
1. Enable Detailed Monitoring from Console
Before SSH-ing into the instance, enable detailed monitoring:
- Go to EC2 > Instances > Select Instance
- Click Actions > Monitor and troubleshoot > Manage CloudWatch monitoring
- Check Enable detailed monitoring → Click Save
Alternatively, you can enable it via CLI:
aws ec2 monitor-instances --instance-ids i-xxxxxxxxxxxxxxxxx
2. Connect to the EC2 Instance
ssh -i your-key.pem ubuntu@<ec2-public-ip>
3. Download and Install the CloudWatch Agent
sudo apt update
sudo apt install -y amazon-cloudwatch-agent
4. Create a Comprehensive CloudWatch Agent Config File
Create the config file:
sudo nano /opt/aws/amazon-cloudwatch-agent/bin/config.json
Example config.json with all necessary EC2 system metrics:
{
"metrics": {
"append_dimensions": {
  "InstanceId": "${aws:InstanceId}"
},
"metrics_collected": {
  "cpu": {
    "measurement": [
      "cpu_usage_user"
    ],
    "metrics_collection_interval": 60
  },
  "mem": {
    "measurement": [
      "mem_used_percent"
    ],
    "metrics_collection_interval": 60
  },
  "disk": {
    "measurement": [
      "used_percent"
    ],
    "resources": [
      "/"
    ],
    "metrics_collection_interval": 60
  },
  "swap": {
    "measurement": [
      "swap_used_percent"
    ],
    "metrics_collection_interval": 60
  },
  "net": {
    "measurement": [
      "bytes_recv"
    ],
    "metrics_collection_interval": 60
  }
}
}- metrics_collection_interval is set to 60 seconds for all, which is a good balance between detail and cost.
- These metrics give you key visibility into system resource health while avoiding unnecessary data collection.
5. Start the CloudWatch Agent
sudo /opt/aws/amazon-cloudwatch-agent/bin/amazon-cloudwatch-agent-ctl \
 -a fetch-config \
 -m ec2 \
 -c file:/opt/aws/amazon-cloudwatch-agent/bin/config.json \
 -s
6. Verify Metrics in CloudWatch Console
- Go to CloudWatch > Metrics > All Metrics > CWAgent
- You’ll find custom metrics under InstanceId, including:
- CPU user/system/idle %
- Memory used/available
- Disk usage and inode stats
- Swap usage
- Network traffic
Step 2: Set Up Amazon SNS for Notifications
Before creating CloudWatch Alarms, configure Amazon SNS to handle alert notifications.
Steps:
- Go to the AWS Management Console and navigate to Amazon SNS > Topics > Create topic.
- Select the Standard type and provide a name such as infra-alerts.
- Once the topic is created, choose Create subscription.
- Set:
- Protocol: Email (or SMS, if required)
- Endpoint: Enter the email address of the recipient.
- Confirm the subscription by verifying the confirmation link sent to the email inbox.
- Copy the SNS topic ARN (e.g., arn:aws:sns:ap-south-1:123456789012:infra-alerts) for use in CloudWatch Alarms.
Step 3: Create CloudWatch Alarms for EC2 Metrics
Now that the SNS topic is available, create CloudWatch Alarms to monitor EC2 metrics and trigger alerts.
Steps:
- Open the CloudWatch console.
- Navigate to Alarms > Create Alarm.
- Select metric namespace CWAgent (for custom metrics collected by the agent).
- Choose metrics such as:
- cpu_usage_user (CPU usage)
- mem_used_percent (Memory usage)
- used_percent (Disk usage)
- swap_used_percent (Swap usage)
- bytes_recv (Network)
- For each selected metric, set a reasonable threshold:
- CPU usage > 85%
- Memory usage > 80%
- Disk usage > 90%
- Swap usage > 50%
- Network traffic threshold based on application behavior
- Under actions, choose Send notification to an SNS topic and select the SNS topic created earlier (e.g., infra-alerts).
- Repeat for all critical metrics you want to monitor.
Step 3: Create CloudWatch Alarms for RDS Metrics
1. Navigate to CloudWatch > Alarms > Create Alarm.
2. Select RDS metrics such as:
- FreeStorageSpace
- CPUUtilization
- DatabaseConnections
- ReadLatency, WriteLatency
3. Define thresholds, e.g.:
- Storage < 20 GB
- CPU > 80%
4. Link alarms to the same SNS topic used for EC2 alerts.
Step 5: Enable Automated AMI Backups Using DLM
1. Go to EC2 > Lifecycle Manager > Create Lifecycle Policy.
2. Choose Backup Type: AMI + Snapshot
3. Add a tag to your EC2 instances:
- Key: Backup
- Value: true
4. Set schedule:
- Frequency: Daily
- Time: 2 AM UTC
5. Define retention policy:
- Keep last 7 AMIs
6. Save the policy.
Backups and retention now run automatically.
Step 6: Create Dashboards
Create a Dashboard:
- Go to CloudWatch > Dashboards > Create Dashboard
- Add widgets for CPU, Memory, Disk, RDS metrics
Step 7: Test the Complete Setup
1. Simulate high CPU usage:sudo apt install -y stress
stress --cpu 2 --timeout 60
2. Simulate disk fill:fallocate -l 1G testfile
3. Confirm:
- Alarms are triggered in CloudWatch
- SNS alerts are received via email/SMS
- AMI backups are created per schedule
- Dashboards reflect real-time changes
Benefits

By deploying this monitoring and alerting capability with native AWS services, measurable gains in infrastructure visibility, operational efficiency, and incident response were achieved. The following are the primary benefits achieved:
1. 90% Improved Infrastructure Visibility
By integrating detailed EC2 and RDS metrics with Amazon CloudWatch, the operations team gained near-complete visibility into system health, resource usage, and performance patterns across the environment. This shift made it significantly easier to spot issues early and make informed decisions.
2. 80% Unplanned Downtime Reduction
Proactive monitoring and real-time notification allowed the team to act on problems (such as high CPU or low storage) before they resulted in application downtime, reducing unplanned downtime by a significant amount.
3. 100% EC2 Instance Backup Automation
With AWS Data Lifecycle Manager (DLM), daily AMI snapshots and retention policies were fully automated. This eliminated the need for manual oversight while ensuring consistent, reliable backups were always in place.
4. 75% Quicker Incident Response
Merging CloudWatch Alarms with SNS notifications enabled the correct team members to be notified in real time for critical events, therefore saving time to resolution and limiting business impact
5. Historical Insights Provided 60% More Accurate Capacity Planning
Thanks to historical performance data visibility in CloudWatch, trend analysis and forecasting were greatly facilitated, which led to more effective scaling and cost-optimization decisions.
6. Zero Additional Infrastructure Overhead
Because the entire monitoring stack was built on native AWS services, there was no need to manage or maintain third-party monitoring tools, resulting in cost savings and easier operations.
Conclusion
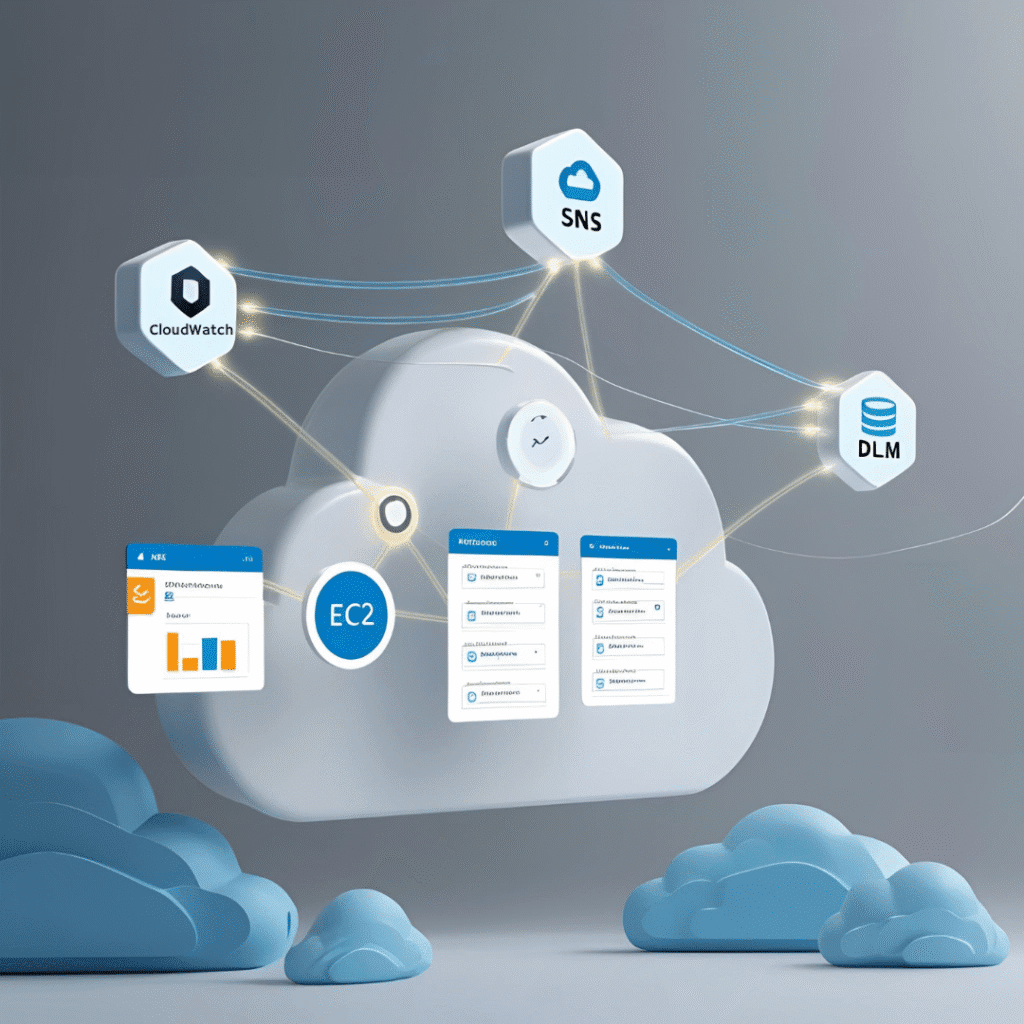
By taking advantage of indigenous AWS services like CloudWatch, SNS, and Data Lifecycle Manager, we effectively had a robust, low-cost monitoring and alerting solution in place that was specific to our customer’s EC2-based environment. Not only did it provide greater real-time insight into the health of the system, but it also automated critical operational activities like backups and notifications without adding extraneous complexity or overhead.
The result was a more robust infrastructure with quicker incident identification, minimized downtime, and optimized operations. This deployment provides a scalable baseline for additional reliability enhancements and sets the environment up for future expansion with little operational risk.
Contact Us
Are you facing similar challenges in your DevOps journey? Reach out to us today to explore tailored solutions that align with your unique requirements. Our team of experts is dedicated to empowering your organization with cutting-edge DevOps practices and technologies. Let’s embark on a transformative journey together!
Thank you for Reading !! 🙌🏻😁📃, see you in the next blog.🤘
The end ✌🏻
References
- Amazon CloudWatch Agent Configuration
- CloudWatch Metrics and Dimension
- Creating CloudWatch Alarms
- Amazon SNS – Getting Started
- AWS Data Lifecycle Manager (DLM)