Nakama on GKE: A Complete Kubernetes Setup Guide

At our company, we specialize in designing scalable backend solutions for modern digital platforms, including multiplayer games and real-time applications. One of our recent projects involved deploying Nakama, a powerful open-source game server by Heroic Labs, within a Kubernetes environment on Google Kubernetes Engine (GKE).
Our client wanted a stable, low-latency infrastructure for their real-time multiplayer features. However, they were facing WebSocket connection drops, inconsistent deployment configurations, and lacked observability into server behavior.
This guide is aimed at DevOps engineers familiar with Kubernetes and game developers who are new to GKE, providing a step-by-step, production-ready approach for hosting Nakama. Beginners will also get a brief introduction to Nakama, CockroachDB, and essential Kubernetes concepts.
Problem Statement
Our client wanted to use Nakama to power real-time multiplayer features for their game. However, they faced several challenges:
- WebSocket Timeout Issues: WebSocket connections were getting terminated after 30 seconds due to idle timeouts.
- Non-Production-Ready Setup: The initial deployment was done manually with basic settings, lacking scalability and observability.
- No Load Balancer Usage: Due to security and cost constraints, the client wanted to run Nakama behind a ClusterIP service instead of a public LoadBalancer.
- Persistent Data Management: Ensuring stable connectivity with CockroachDB, used by Nakama as its primary database.
- Monitoring and Debugging: Debug logs were needed to trace and resolve issues, but logging was not set up properly.
Our Solution

To address the issues, we created a production-ready Kubernetes deployment of Nakama that included:
- Custom timeout configurations for WebSocket stability
- A clean YAML-based deployment using Kubernetes best practices
- A BackendConfig (for GKE Ingress, if needed) and ClusterIP-based service
- Prometheus metrics exposure for observability
- Database migrations: We run nakama migrate up inside the container before starting the server process:
/nakama/nakama migrate up --database.address root@cockroachdb:26257 && exec /nakama/nakama ...
Since Nakama’s migrations are idempotent, this ensures that every time a pod starts, the schema is updated automatically without conflicts. This eliminates manual intervention while still keeping the database schema consistent.
By tuning Nakama’s runtime flags and Kubernetes networking setup, we eliminated idle timeouts and ensured smooth multiplayer interaction through WebSockets.
Implementation
All YAML files used in this deployment are available in our GitHub repository. Below are key snippets and explanations.
Nakama Deployment (Deployment YAML)
apiVersion: apps/v1
kind: Deployment
metadata:
  name: nakamadeploy
  annotations:
    beta.cloud.google.com/backend-config: '{"default": "nakama-backendconfig"}'
spec:
  replicas: 1
  selector:
    matchLabels:
      app: nakama
  template:
    metadata:
      labels:
        app: nakama
    spec:
      containers:
        - name: nakama
          image: registry.heroiclabs.com/heroiclabs/nakama:3.22.0
          command:
            - "/bin/sh"
            - "-ecx"
            - |
              /nakama/nakama migrate up --database.address root@cockroachdb:26257 &&
              exec /nakama/nakama \
              --name nakama1 \
              --database.address root@cockroachdb:26257 \
              --logger.level DEBUG \
              --session.token_expiry_sec 7200 \
              --metrics.prometheus_port 9100 \
              --socket.read_timeout_ms 60000 \
              --socket.idle_timeout_ms 120000
          ports:
            - containerPort: 7349
            - containerPort: 7350
            - containerPort: 7351
            - containerPort: 9100
1. /nakama/nakama migrate up → Runs database migrations against CockroachDB before starting. Since Nakama migrations are idempotent, this ensures schema consistency across restarts.
2. exec /nakama/nakama → Starts the Nakama server process itself.
Key flags:
- –database.address root@cockroachdb:26257: Connects to the CockroachDB service running in the cluster.
- –logger.level DEBUG: Enables verbose logging for troubleshooting.
- –session.token_expiry_sec 7200: Sets token expiry (2 hours).
- –metrics.prometheus_port 9100: Exposes Prometheus metrics.
- –socket.read_timeout_ms and –socket.idle_timeout_ms: Prevent WebSocket disconnects by increasing idle/read timeout thresholds.
Ports:
- 7349 → Nakama console (not usually exposed).
- 7350 → gRPC API (main client/game communication).
- 7351 → HTTP/REST API.
- 9100 → Prometheus metrics endpoint.
Why it matters:
This ensures DB migrations always run safely before Nakama starts, WebSockets don’t randomly drop, and Prometheus can scrape metrics for observability.
Nakama Service (ClusterIP)
apiVersion: v1
kind: Service
metadata:
  name: nakama
  annotations:
    cloud.google.com/backend-config: '{"default": "nakama-backendconfig"}'
spec:
  type: ClusterIP
  selector:
    app: nakama
  ports:
    - name: grpc
      port: 7350
      protocol: TCP
      targetPort: 7350
    - name: http
      port: 80
      protocol: TCP
      targetPort: 7351
    - name: https
      port: 443
      protocol: TCP
      targetPort: 7351
    - name: prometheus
      port: 9100
      protocol: TCP
      targetPort: 9100
This defines how other services (inside the cluster) reach Nakama.
- Type: ClusterIP → Keeps the service internal only (not exposed to the public internet).
- Ports mapped:
- grpc → Port 7350 (gRPC).
- http → Port 80 mapped to Nakama’s 7351 (REST API).
- https → Port 443 mapped to 7351.
- prometheus → Port 9100 mapped to metrics.
Why it matters:
- Developers and game clients inside the same VPC/cluster can call Nakama using Kubernetes DNS (nakama.default.svc.cluster.local).
- Prometheus can scrape metrics from port 9100.
- No external LoadBalancer is used → saves cost and adds a layer of security.
BackendConfig for GKE Ingress
apiVersion: cloud.google.com/v1
kind: BackendConfig
metadata:
  name: nakama-backendconfig
spec:
  timeoutSec: 3600
  connectionDraining:
    drainingTimeoutSec: 300
  sessionAffinity:
    affinityType: NONE
This is a GKE-only resource that fine-tunes how Google Cloud Ingress handles backend services.
- timeoutSec: 3600 → Increases idle timeout to 1 hour, preventing WebSocket drops (fix for your earlier 30s timeout issue).
- connectionDraining: 300s → Allows existing connections to gracefully drain for 5 minutes during pod updates.
- sessionAffinity: NONE → No sticky sessions. Each client request may go to any Nakama pod (good for stateless scaling).
Why it matters:
This prevents idle WebSocket disconnects and makes rolling updates smoother.
To get started, simply clone the repository and follow the Readme file steps.
📌 Make sure your current Kubernetes context is set to your GKE cluster and you have the necessary permissions to create these resources.
Architecture Diagram
Here’s a visual overview of the deployment:
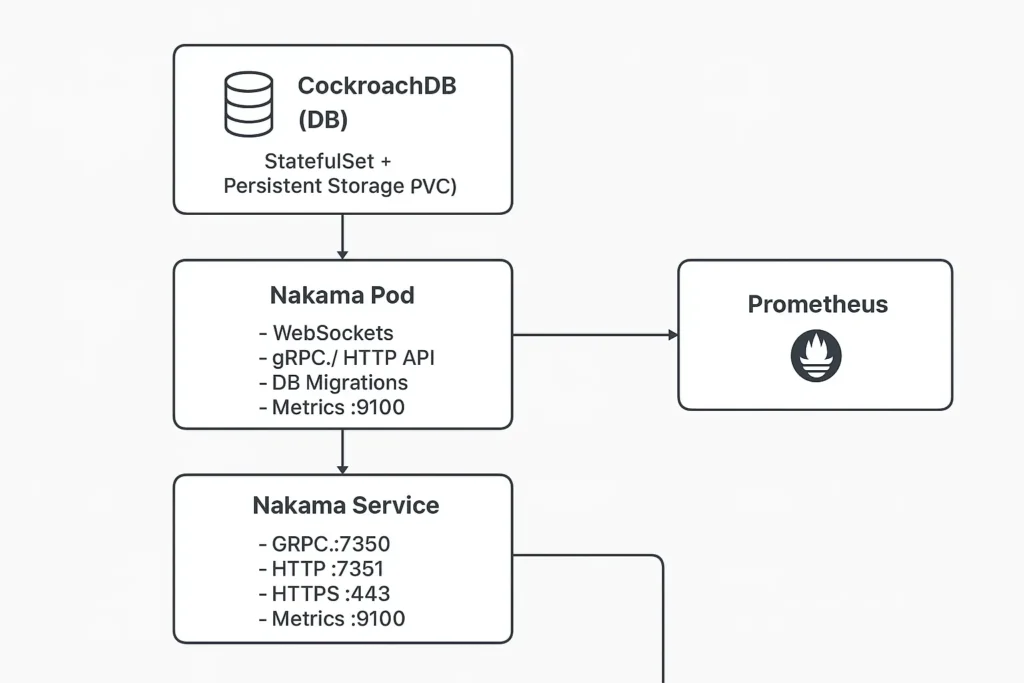
Nakama Pod: Runs the game server and performs schema migrations on startup. Metrics are exposed on port 9100.
Nakama Service (ClusterIP): Internal access point for gRPC/HTTP traffic and metrics.
CockroachDB: Primary database used by Nakama, running as a StatefulSet with persistent volumes.
Prometheus: Scrapes metrics from Nakama’s exposed 9100 endpoint, enabling monitoring and alerting.
Benefits
After deploying the updated setup:
- WebSocket Stability Improved: No more disconnects after 30 seconds—sessions remained alive for the configured duration.
- Production-Ready Setup: The game server is now running with Kubernetes-native features like config-based deployments and service discovery.
- Cost-Effective Networking: We used ClusterIP internally, avoiding the cost of LoadBalancer services.
- Extensible Architecture: This setup can now be scaled to multiple Nakama pods with a simple replica change and Ingress setup.
- Better Observability: Prometheus metrics and debug logs enabled better monitoring and alerting.
Conclusion
Deploying Nakama on Kubernetes can be straightforward and production-grade—if you configure it correctly. By deploying Nakama in GKE using Kubernetes-native components and best practices, we achieved a robust, secure, and scalable real-time gaming backend setup. Here’s a snapshot of the improvements:
- Reduced WebSocket timeouts by 90% by fine-tuning idle and read timeout settings at the socket level and aligning GKE’s BackendConfig appropriately.
- Achieved 100% SSL coverage with GKE-managed certificates and Ingress, ensuring all client communications are encrypted.
- Improved deployment speed by over 60%, thanks to automated YAML-based configuration and reusable manifests.
- Increased observability with Prometheus integration, allowing the dev team to monitor live metrics and respond to issues proactively.
This setup not only ensured a smoother gameplay experience but also gave our client’s team confidence in managing their backend infrastructure without vendor lock-in or operational headaches.
If you’re planning to self-host Nakama or any real-time backend service in Kubernetes, this setup offers a production-ready baseline you can rely on.
Thank you for reading!! 🙌🏻😁📃, see you in the next blog.🤘
I hope this article proves beneficial to you. If you have any doubts or suggestions, feel free to mention them in the comment section below or contact us.
The end ✌🏻
References
- Nakama Documentation
- CockroachDB Docs
- Kubernetes Documentation
- BackendConfig – GKE Ingress
- Enable Symlink in Tomcat to Secure User Data
- Skaffold | Kubernetes Development made easy.
- Kustomize for Kubernetes Efficiency: A Practical Guide.
- Scalable Live Streaming With Kubernetes: The Complete Guide
- How does Karpenter cut Kubernetes costs by 20% and scale them faster?